
11 Social Media KPIs You Need To Track for Business Growth
Jeffrey
15 February 2023Social media marketing is becoming a must have for business growth. The Social Media Examiner found in a survey that 80% of respondents stated that their social media efforts have resulted in increased exposure for their businesses. Moreover, 92% of marketers stated that social media is important for their business. Now, these benefits can only occur if you’re properly tracking your social media KPIs, also known as key performance indicators.
Why is that? Tracking and analyzing social media KPIs is your base to adjust your social media strategy. You may not get it right straight away, and that’s okay! The best way to find what works for social media strategy is to iterate – try, analyze, and try again!
Let’s get right into what social media KPIs are and which ones to track for business growth!
What you will learn
- What are social media KPIs?
- 11 Social media KPIs you need to know
- How to track social media KPIs for business growth?
What are social media KPIs?
Key performance indicator is a business term that applies to all areas of a business, including social media marketing.
The goal of KPIs is to focus on a number of indicators that you have selected because the successes of these indicators will profit the overall performance of your business. We’re talking revenues and profit. However, the sole focus of this guide will be on social media KPIs to track for business growth.
On each platform, you will need a business account to access the majority of these metrics. You can get the data you need from the analytics section of social platforms. Alternatively, you can use a software like Hubspot to get the social media analytics you want faster without pulling data from each network separately.
11 Social media KPIs you need to know
Your social account success is dependent on two categories of KPIs — reach and engagement metrics.
Social media reach is a generic metric that designates the number of unique individuals who have seen a publication on a social media platform. In fact, it is a metric used to measure the potential audience size for a particular post or ad, and metrics vary depending on social networks.
The level of interaction and participation between users and brands on social media platforms is referred to as social media engagement. Likes, comments, shares, retweets, mentions, and so on are all examples of this interaction. Engagement metrics assist in tracking the impact of a brand’s content and campaigns and measure the success of its social media presence.
Engagement aims at building a relationship with customers, raising brand awareness, and encouraging engagement and sales. Brands can cultivate a loyal and engaged community of followers. Definitely, an engaged community is more likely to generate customers and advocates for the brand by encouraging a high level of engagement on social media.
Social media metrics for reach
What is an impression on social media?
Impressions refer to the number of times a post or advertisement has been displayed on a user’s screen. Specifically, it is a measure of the total number of times a post or ad has been seen by its audience, regardless of how many unique individuals saw it. This metric is mostly reported on Instagram, Twitter and Linkedin.
Impression is a reflection of the score given by the algorithm to the content. The score will generally be based on interests from users for the topic, and previous performance of the page. Indeed, an healthy page should show a growth in the total volume of impressions per post over time.
What does reach mean on social media?
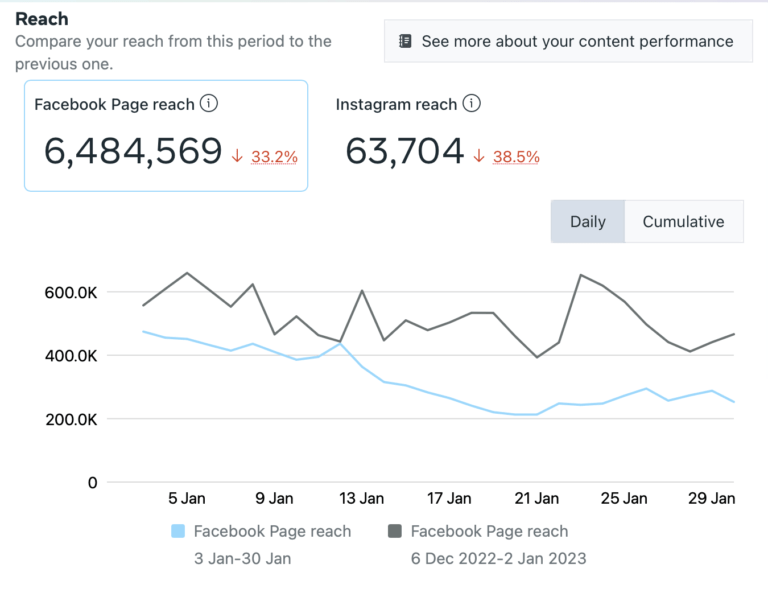
Reach refers to the number of unique individuals who have seen a post or advertisement. It represents the potential visibility and exposure of a post or ad to its audience. Consequently, it is different from the impression metric which counts the number of displays, regardless of how many unique individuals have seen it.
Facebook and Instagram are the main platforms reporting data on your accounts’ reach. Facebook refers to organic reach as the number of unique individuals who have seen a Facebook page’s post through unpaid distribution. In that sense, it measures the organic, or non-paid, reach of a page’s content to its audience.
Organic reach is influenced by factors such as the size of a page’s audience, the relevance and engagement of its content, and the platform’s algorithm. A higher organic reach indicates that more people are seeing and engaging with a page’s content without the need for paid promotion. Good results at organic reach can also be a sign of success from a previous ad campaign.
What is considered a view on social media?
Views refer to the number of times a piece of content, such as a post, video, or image, has been seen on a platform. Views can provide insights into the engagement and popularity of a piece of content, in addition to its reach and potential impact on the audience. Exact definition will vary depending on the platform.
Views on Facebook will be counted from 3 seconds. First, views can be organic, meaning the content was seen through unpaid distribution. Secondly, views can be paid, meaning it was seen as a result of a paid advertising campaign.
Views on Instagram refer to the number of times a video post has been watched more than 3 seconds. Moreover, this metric is only applicable to Reels on Instagram and measures the engagement and popularity of the video content.
On TikTok, a view is counted similarly to an impression, meaning as soon as a user has the video on the screen.
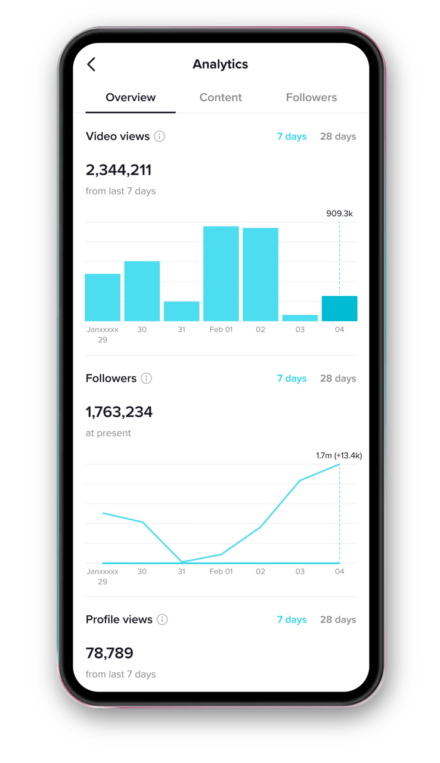
A YouTube view is counted when a viewer watches a video for at least 30 seconds or for the duration of the video if it is shorter than 30 seconds. A view for a YouTube Short is counted when a viewer watches a video for at least 3 seconds.
Why does follower count matter?
The follower metric refers to the number of individuals who have chosen to follow a social media page or profile. A follower is someone who has subscribed to receive updates and content from the page in their newsfeed. As a result, the follower count can serve as a measure of a page’s popularity and reach. It can also provide information on the engagement and loyalty of the audience. Overall, it provide insights into a page’s ability to reach and influence its audience, and can be a useful metric for businesses and marketers to evaluate the success of their presence.
Follower growth is an important metric to pay attention to. A higher rate of follower growth can suggest that a page is effectively reaching and engaging its audience, and may indicate opportunities for further growth and expansion.
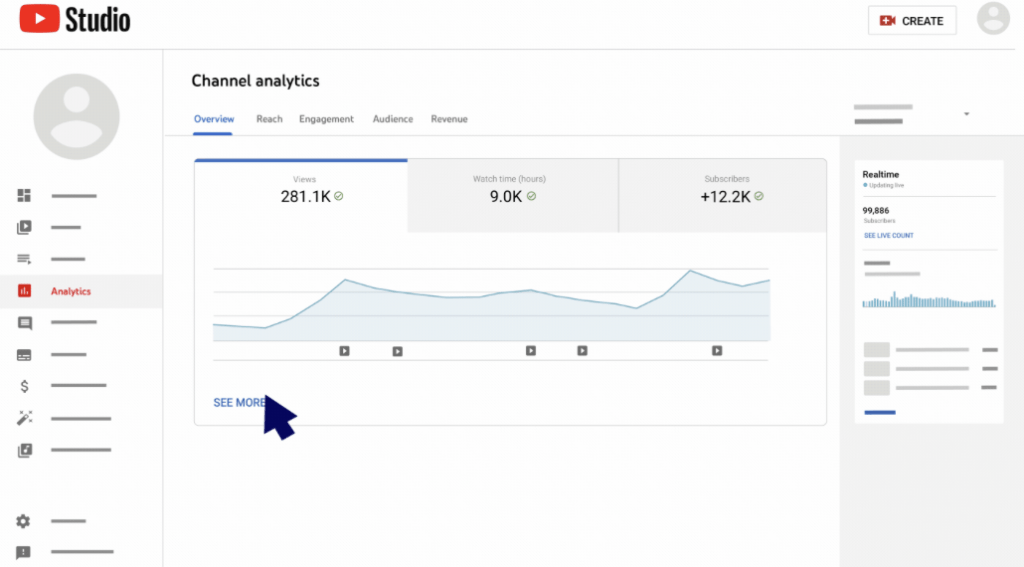
Follower count is available on most social media platforms. Definition is quite similar, except for YouTube which call them subscribers. A YouTube subscriber is an individual who has chosen to follow a YouTube channel by clicking the “Subscribe” button.
By subscribing to a channel, users can easily access and keep up with their favorite content on YouTube, in addition to interact with the channel by leaving comments, liking videos, and more. Having a large number of subscribers can be a sign of a popular and successful channel, and can help content creators to build a following and reach a larger audience.
Social media metrics for engagement
Engagement metrics are here to help you understand how your audience is interacting with your content or brand. Indeed, they can be used to evaluate the success of a campaign and assess the effectiveness of a social media post. Engagement KPIs provide a great way to monitor the overall health of your brand or page. For example, a great way to assess engagement performance is to look at the ratio of engagement out of impressions. Consistently compare that ratio over time to get a sense of how you’ve improved your engagement techniques. A low engagement ratio means in simple terms that the algorithm is pushing your content, but viewers are not willing to engage.
Most common ways for users to engage with posts are to use likes or reactions, comments, and shares. Still, exact metrics can differ slightly by social network, so here is a quick recap of what to look at on each platform:
Facebook: Likes, Comments, Shares, Reactions, Clicks
Instagram: Likes, Comments, Shares, Story Views, Saves
TikTok: Likes, Shares, Comments, Reactions, Favorites
Twitter: Retweets, Likes, Replies, Mentions, Hashtag clicks
LinkedIn: Likes, Shares, Comments
YouTube: Likes, Dislikes, Comments, Shares
Social media metrics for conversion
Conversion refers to the number of people receiving a marketing message who take a desired action, such as making a purchase, filling out a form, or signing up for a newsletter. This is less universal and has to be defined for your own purposes. Social media can be involved in parts of the funnel and redirect potential customers to your website or various links. Here are a few metrics that can be used along the conversion funnel:
Click-through rate (CTR) is the ratio of clicks to impressions. CTR measures the number of clicks your content receives, such as links in an email or on a website. This metric can help you determine how effective your calls-to-action are.
Bounce rate is the percentage of visitors who leave a site after viewing only one page. A high bounce rate can indicate that visitors are not finding what they were looking for. Or, it can also mean they or not finding your content engaging enough to stay and explore your site further.
Time on site measures how long a user spends on your website or page. This metric can help you understand how engaging your content is and how well it holds users’ attention.
Lead generation is another important metric to track, it is simply the number of leads generated from social media. This is an overall performance metric that tells you how effective your strategy is. Therefore, if you’re not satisfied with this metric’s performance, take a closer look at data for all the steps of your funnel. This will allow you to identify where the improvement opportunities are.
How to track social media KPIs for business growth?
Now that KPIs are hopefully clearer, here are some steps that you can follow to start tracking social media KPIs:
Define your goals
Before tracking any KPIs, it’s important to spend a substantial amount of time defining what the business wants to achieve through its social media presence. This could be increasing brand awareness, driving traffic to a website, generating leads, or increasing sales. Once you have set them, this should impact your content process.
Select relevant KPIs
Based on the business goals, select KPIs that are relevant and directly tied to those goals. For example, if the goal is to increase brand awareness, reach and impressions could be key metrics to track.
Use the right tools
There are numerous tools available to help track social media KPIs. Amongst the options, you will find both native analytics platforms provided by each social media platform and third-party analytics tools. Pick a tool that best fits the business needs and budget.
Set baseline and objectives
Then, establish a baseline for each KPI. This will make it easier to measure the success and impact of social media efforts over time
Monitor regularly
Pick a recurring slot in your calendar to monitor and track the KPIs. This will help you see how the social media efforts are impacting the business goals. Use this data to make informed decisions about future strategies and campaigns.
Analyze and adjust
Analyze the data regularly to identify trends and patterns. Use this information to adjust and refine the social media strategies to maximize their effectiveness and achieve the desired goals.
Conclusion
Despite the fact that it can be an effective tool for businesses, it is essential to keep in mind that social media is not a one-size-fits-all solution. For example, the kind of business, the people who are the target audience, and the specific social media platforms that are being used all play a role in how successful social media marketing is. As a result, for your social media marketing strategy to be successful, you must target the right platforms, with the right content. Then, you can look to maximize the right indicators.
By following these steps, you can effectively track and analyze social media KPIs to make informed decisions and achieve your goals through social media. Don’t hesitate to review your content pillars in the light of your KPI analysis overtime. Finally, it’s time to nerd out, you will thank yourself later!

